Pengi Editor's Note: This article was originally published by Think Academy. We're sharing it here for educational value. Think Academy is a leading K-12 math education provider.
What Is a Function? Representing with Tables, Graphs, and Mappings
By Grade 7 at Think Academy (Grade 8 in school), students learn what functions are and how to represent them with tables, graphs, and mappings. The challenge is not defining a function, but applying the “one input–one output” rule consistently—many confuse domain and range, struggle with table patterns, misread graphs, or get lost in mapping diagrams. This guide explains each representation clearly so those misunderstandings don’t block progress.
What Is a Function?
A function is a special type of relationship between two sets of numbers: an input and an output.
- Each input value has exactly one output value.
- Different input values can share the same output value.
- Inputs are usually called the domain.
- Outputs are usually called the range.
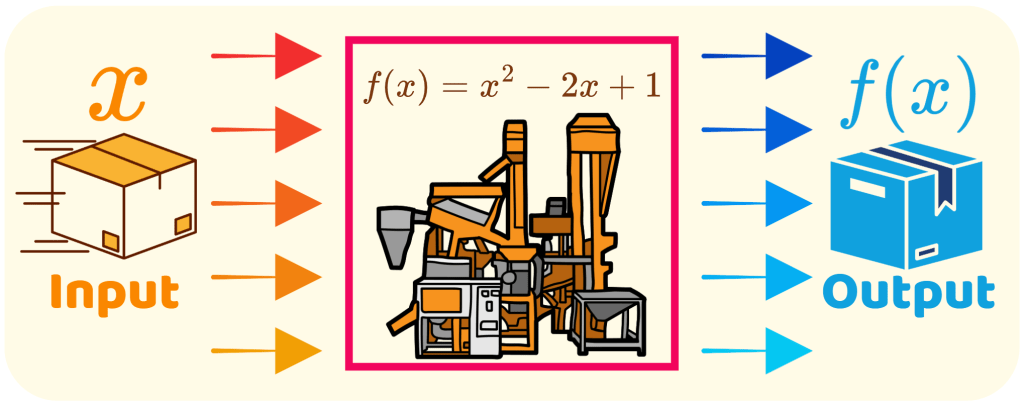
A function can be thought of as a “machine”: put in an input, the machine follows a relationship, and we always get one output.
Ways to Represent a Function
In the following sections, we will use different methods to represent the same function:
𝑓(𝑥) = 𝑥² − 2𝑥 + 1
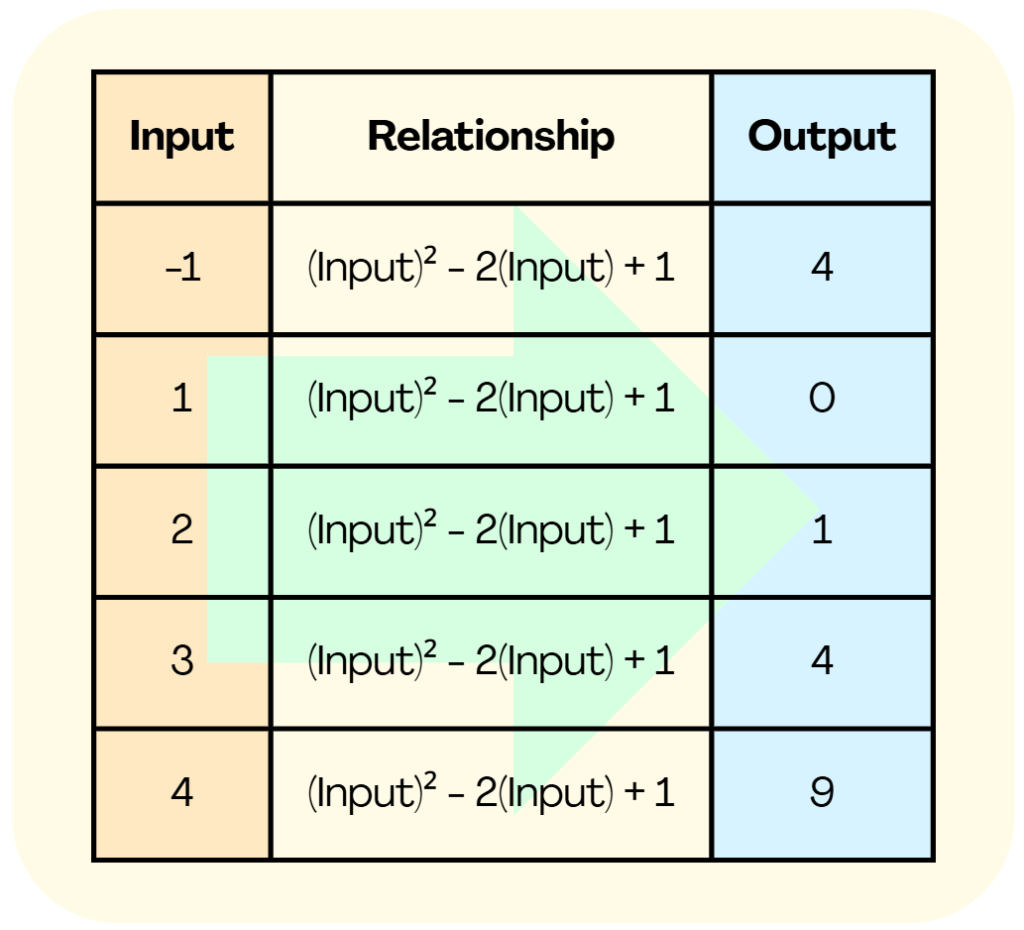
Using a Table to Represent a Function
A table lists inputs and outputs side by side.
Using a Graph to Represent a Function
A graph plots input-output pairs as points on the coordinate plane.
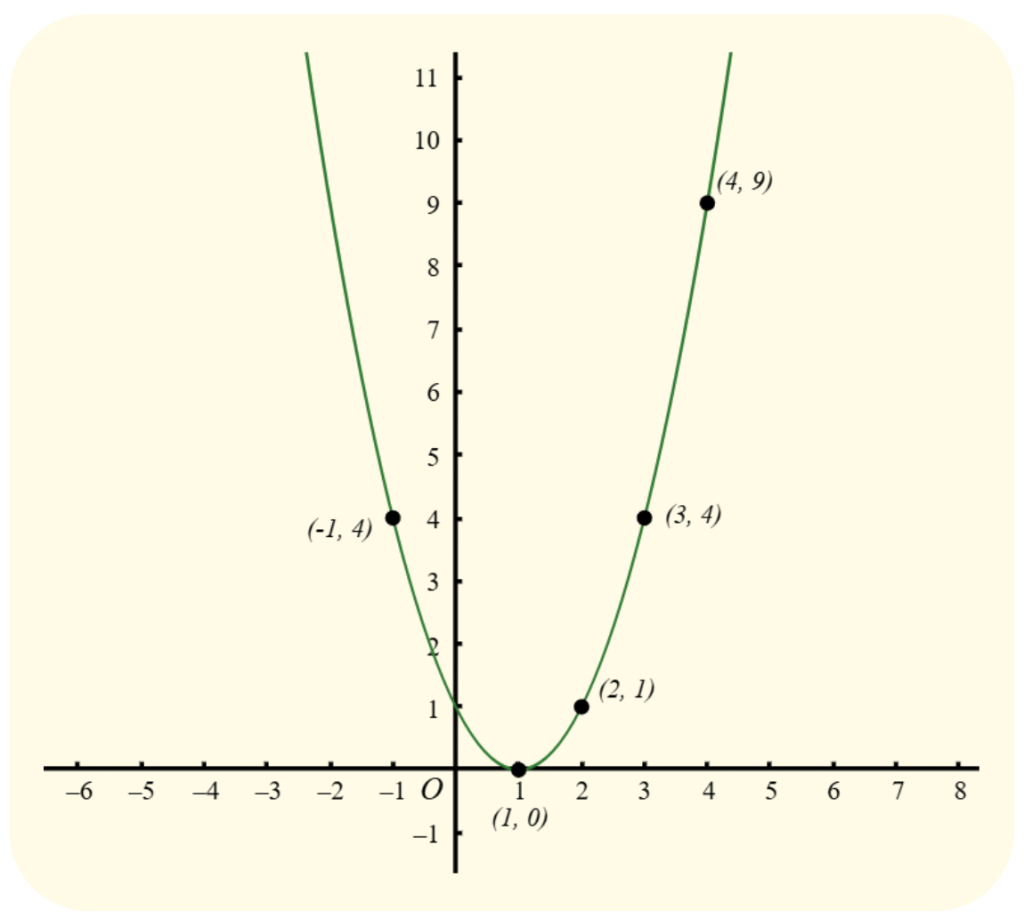
The table above would give the points (−1, 4), (1, 0), (2, 1), (3, 4), (4, 9). Connecting them makes the relationship easy to see.
Using Mappings to Represent a Function
A mapping diagram shows arrows connecting inputs to their outputs.
- Draw one column of input numbers.
- Draw one column of output numbers.
- Connect each input to its output with an arrow.
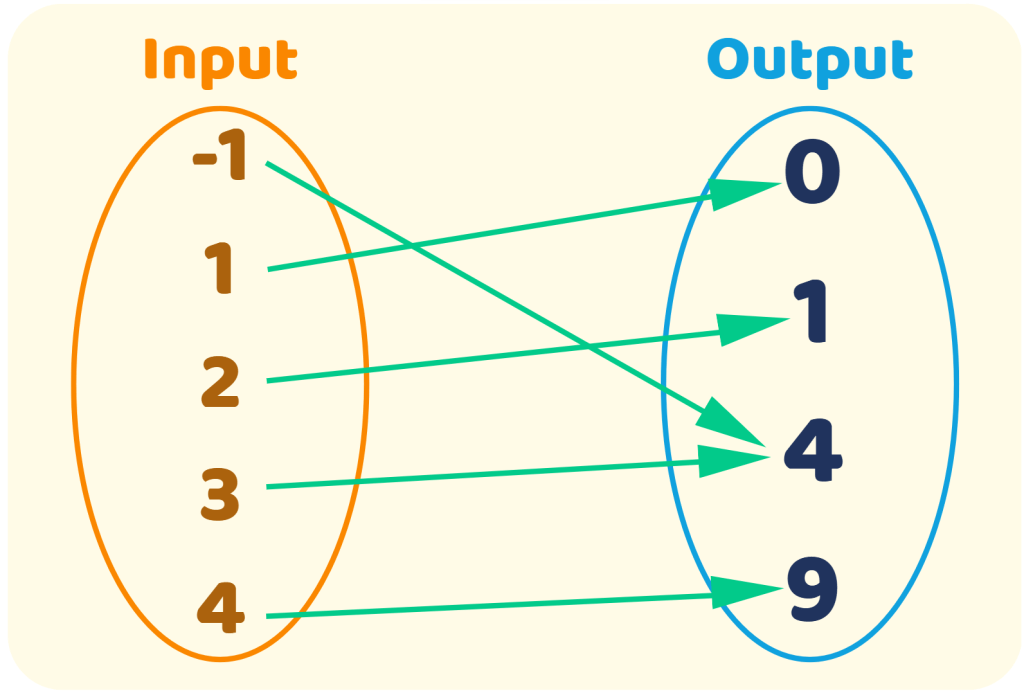
This makes it very clear that each input has only one output.
Other Ways to Represent a Function: Ordered Pairs
A function can also be represented as a set of ordered pairs:
{ (−1, 4), (1, 0), (2, 1), (3, 4), (4, 9) }
In each pair, the first number represents the input, and the second number represents the output.
Example Problems: Representing a Function
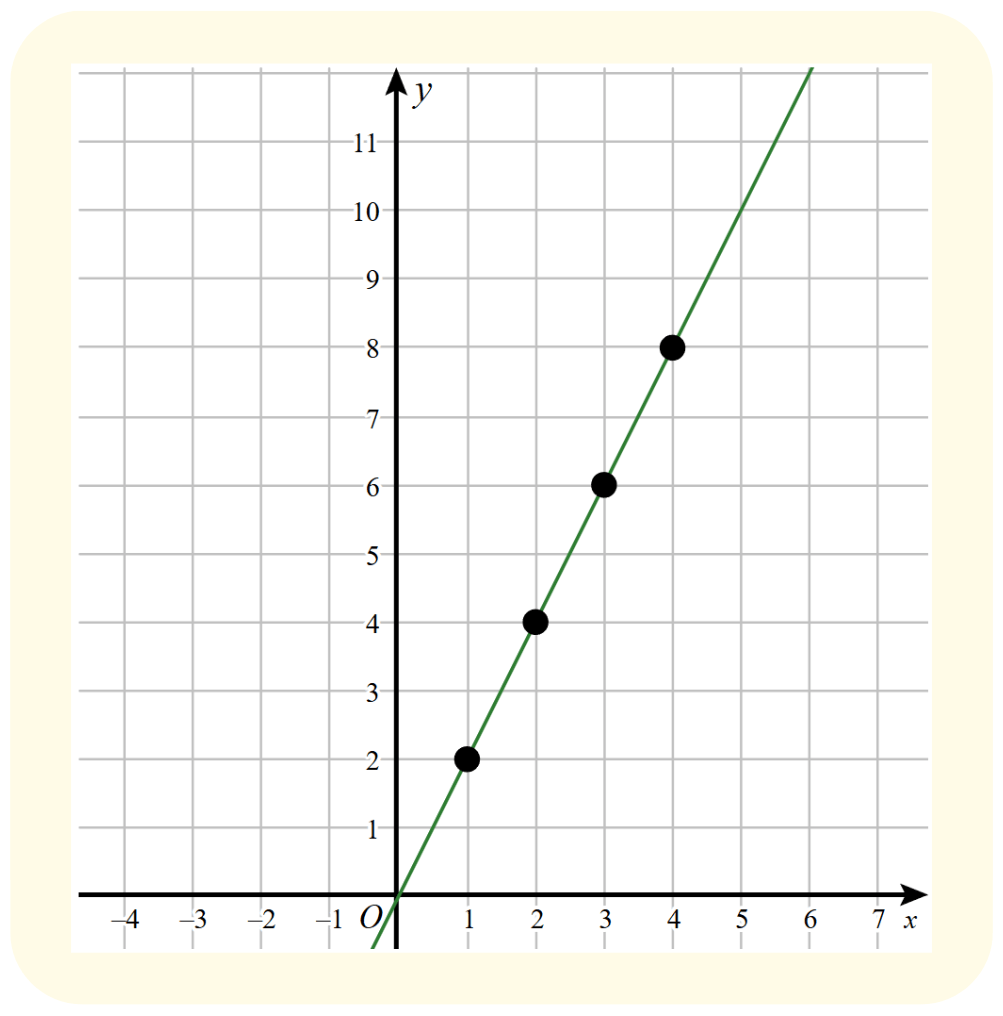
1.The graph of an equation is shown in the figure. Based on the graph, complete the table of 𝑦 (output) in terms of 𝑥 (input).
| 𝑥 (Input) | 𝑦 (Output) |
|---|---|
| 1 | |
| 4 | |
| 3 | |
| 8 |
Answer:
| 𝑥 (Input) | **𝑦 (Output) |
|---|---|
| 1 | 2 |
| 2 | 4 |
| 3 | 6 |
| 4 | 8 |
2. Which set of ordered pairs represents 𝑦 (output) as a function of 𝑥 (input)?
A. { (1, 5), (2, 5), (3, 5), (4, 5) }
B. { (5, 1), (5, 2), (5, 3), (5, 4) }
C. { (1, 3), (2, 6), (1, 9), (4, 12) }
D. { (3, 1), (6, 2), (3, 7), (12, 4) }
Answer:
For 𝑦 to be a function of 𝑥, each 𝑥-value must map to exactly one 𝑦-value.
For A: { (1, 5), (2, 5), (3, 5), (4, 5) }, all 𝑥-values (1, 2, 3, 4) are unique, so each 𝑥 maps to exactly one 𝑦.
For B: { (5, 1), (5, 2), (5, 3), (5, 4) }, the 𝑥-value 5 maps to multiple 𝑦-values.
For C: { (1, 3), (2, 6), (1, 9), (4, 12) }, the 𝑥-value 1 maps to multiple 𝑦-values.
For D: { (3, 1), (6, 2), (3, 7), (12, 4) }, the 𝑥-value 3 maps to multiple 𝑦-values.
Only option A satisfies the condition for 𝑦 to be a function of 𝑥.
The answer is A.
Summary: Representing a Function
- In a function, different inputs to share the same output (many-to-one) is possible, but a single input can never have two or more outputs.
- Functions can be shown in many ways: tables, graphs, mappings, and many other forms.
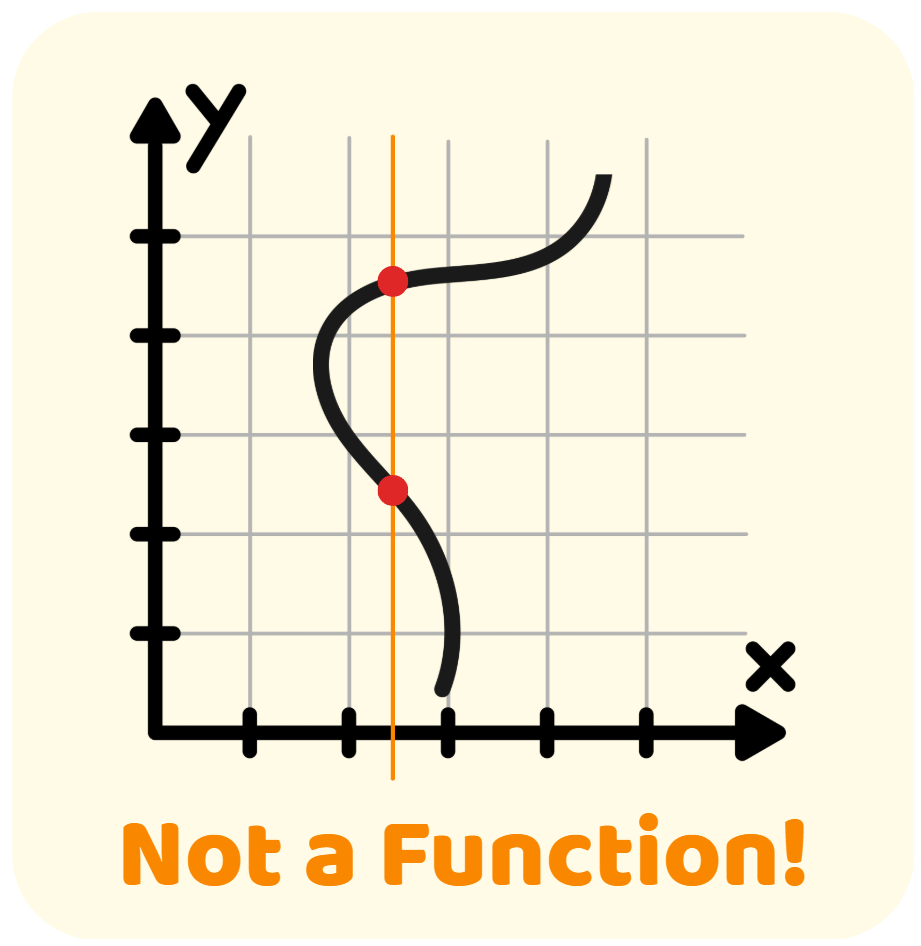
- To test if a relation is a function, check whether each input has one unique output. If on a graph, we can use the Vertical Line Test: if any vertical line crosses the graph at more than one point, then it is not a function.
Want more printable practice?
Download Grade 8 Free Worksheets
Additional Math Topics for Grade 8 – with Free Worksheets
More Middle School Algebra Resources Ready for You
We’ve created a full library of printable resources — from foundational math to logic-based challenges — organized by grade to support every stage of your child’s journey.
Explore the K–12 Worksheets Hub
More related articles
- How to Solve Equations with Variables on Both Sides in 3 Simple Steps
- How to Solve Equations with Parentheses in 4 Simple Steps
- How to Solve Equations with Fractions and Decimals in 3 Simple Steps
- Identifying Linear vs. Nonlinear Functions
Think Academy Math Program
If you’re looking to build on math strengths or close math gaps, we offer comprehensive K–12 math programs designed to:
- Catch up: Fill in gaps and strengthen foundational skills
- Stay ahead: Maintain a competitive edge and accelerate math progress
- Go further: Take on challenge math competitions, Math kangaroo, AMC competitions
Next Step: Take a personalized evaluation to understand your child’s current math progress and get a tailored roadmap for courses, pacing, and goals.
Try Pengi AI — Smarter Math Practice for Students
Pengi AI supports K–12 learners with personalized math practice, guided explanations, and feedback designed to help them build confidence and improve steadily.