Pengi Editor's Note: This article was originally published by Think Academy. We're sharing it here for educational value. Think Academy is a leading K-12 math education provider.
SAT Score Range 2026: What Is a Good, High, and Perfect SAT Score?
SAT scores aren’t required at every college—but they still matter. Many top schools, like Yale, recommend submitting them to show academic readiness. Others, including Dartmouth and MIT, now require them again. In this guide, we’ll explain what makes a good SAT score, how to set your target, and how scores compare across the new SAT, old SAT, and ACT.
SAT Score Range (2026): How the 400–1600 Scale Works
The maximum SAT score possible is 1600. This is often referred to as a perfect SAT score. Your total SAT score is made up of two section scores:
- Math: 200 to 800
- Reading and Writing (ERW): 200 to 800
Each section is scored independently, then combined for a total score between 400 and 1600. For example: If you score 750 in Math and 740 in Reading and Writing, your total score would be 1490.
You’ll also receive:
- Percentile rankings: Showing how you compare to other students
- Subscores: Offering insight into specific skill areas (e.g. algebra, grammar)
What Is a Good SAT Score in 2026?
In general, a good SAT score is around 1200 or higher. The SAT total score ranges from 400 to 1600, combining scores from two sections: Math and Evidence-Based Reading and Writing (ERW).
The national average SAT score is around 1050. According to SAT percentile data, a 1200 score places a student around the 75th percentile, meaning they scored higher than about three-quarters of test-takers.
For many students, a score between 1280 and 1350 is widely considered a strong SAT score. This range typically falls between the 84th and 90th percentiles, placing students among the top 10–15% of test-takers.
A simple way to understand SAT scores is to look at how they compare with other test-takers nationally.
- Around 1050 – This is approximately the national average SAT score.
- Around 1200 – About the 75th percentile, meaning the student scored higher than roughly three-quarters of test-takers. This is generally considered above average.
- 1280–1350 – Roughly the 84th–90th percentile, placing students among the top 10–15% of test-takers. This range is widely considered a strong SAT score for many selective colleges.
- 1350–1450 – Approximately the 90th–96th percentile, often considered an excellent score for competitive universities.
- 1450–1600 – Roughly the 96th–99th percentile, representing outstanding performance and placing students among the top test-takers nationwide.
Ultimately, the right target score depends on the selectivity of the colleges on your application list.
What Is a Good SAT Score by Section?
The College Board defines college readiness benchmarks at the section level:
- 480 in Reading and Writing
- 530 in Math
Students who meet or exceed these benchmarks are considered on track for college readiness, meaning they have about a 75% chance of earning a C or higher in related first-semester college courses.
However, these benchmarks represent minimum readiness levels, not what is typically competitive for selective college admissions.
Math Section Benchmarks (200–800)
The SAT Math section ranges from 200 to 800 points. Colleges often look closely at Math scores for students applying to STEM majors such as engineering, computer science, or mathematics.
Typical Math score benchmarks include:
- Around 500 – Close to the national average Math score.
- 530 or higher – Meets the College Board’s college readiness benchmark, indicating a student is likely prepared for entry-level college math courses.
- 650–700 – Considered a strong Math score, typically around the 85th–92nd percentile.
- 750–800 – A highly competitive score, often seen among applicants to top STEM universities such as MIT, Caltech, and Carnegie Mellon.
Highly selective STEM programs, such as MIT or Caltech, often see Math scores in the 750–800 range.
Reading and Writing (ERW) Benchmarks (200–800)
The Evidence-Based Reading and Writing (ERW) section also ranges from 200 to 800 points.
Typical ERW score benchmarks include:
- Around 520 – Approximately the national average score.
- 480 or higher – Meets the College Board’s college readiness benchmark, suggesting readiness for first-year college reading and writing coursework.
- 600–680 – A strong ERW score, generally placing students between the 74th and 90th percentiles.
- 700–800 – A highly competitive score, often seen among applicants to selective universities.
Strong ERW scores may be particularly valuable for students pursuing majors in humanities, journalism, political science, or other writing-intensive fields.
How Colleges Evaluate SAT Scores
To better understand how SAT scores translate into college competitiveness:
| SAT Score | Percentile | Typical Competitiveness |
|---|---|---|
| 1500+ | Top ~2% | Competitive for Top 30 universities |
| 1400+ | Top ~7% | Competitive for many Top 50 universities |
| 1350+ | Top ~10% | Strong for many Top 80 universities |
| 1280+ | Top ~15% | Competitive for many Top 100 universities |
Next, let’s take a closer look at SAT scores from the college admissions perspective. The table below shows typical SAT ranges for top tier universities.
Ivy League & Top 20 Mid-50% SAT Ranges (updated August 2025)
| Rank | University | SAT Mid 50% |
|---|---|---|
| 1 | Princeton University | 1470-1560 |
| 2 | Massachusetts Institute of Technology (MIT) | 1520-1570 |
| 3 | Harvard University | 1500-1580 |
| 4 | Stanford University | 1510-1570 |
| 5 | Yale University | 1480-1560 |
| 6 (tie) | California Institute of Technology (Caltech) | Not Available |
| 6 (tie) | Duke University | 1520-1570 |
| 6 (tie) | Johns Hopkins University | 1530-1560 |
| 6 (tie) | Northwestern University | 1510-1560 |
| 10 | University of Pennsylvania | 1500-1570 |
| 11 | Cornell University | 1510-1560 |
| 11 | University of Chicago | 1510-1560 |
| 13 | Brown University | 1470-1550 |
| 13 | Columbia University | 1510-1560 |
| 15 | Dartmouth College | 1510-1560 |
| 15 | University of California, Los Angeles (UCLA) | 1290-1510 |
| 17 | University of California, Berkeley (UCB) | 1340-1540 |
| 18 | University of Notre Dame | 1470-1540 |
| 18 | Rice University | 1510-1560 |
| 18 | Vanderbilt University | 1510-1560 |
*Data Source: College board and US News. Reported SAT ranges may not reflect all enrolled students. At test-optional institutions, applicants are not required to submit scores, so published data only includes students who chose to provide them.
Target the Top 25% of a School’s Middle-50% Range
Looking at the 2025 U.S. News Top 20 universities, the middle 50% SAT ranges confirm this pattern. Harvard (1500–1580), MIT (1520–1570), and Stanford (1510–1570) admit students with almost exclusively 1500+ scores. Yale, Princeton, Columbia, Penn, and Northwestern cluster around 1470–1570. Even selective non-Ivies like Rice and Vanderbilt expect 1510–1560.
Public flagships show more range. UCLA admits students between 1290–1510, while UC Berkeley ranges from 1340–1540, making 1400+ a strong position for UC admission, especially in competitive majors.
Tip: Many colleges publish the middle 50% SAT range of their admitted students. A strong strategy is to aim for the top 25% of that range to stand out.
While very few students achieve a perfect 1600, aiming for a 1500+ score places you in a highly competitive range for the nation’s most selective universities and merit-based scholarships.
In short, a good SAT score is not one-size-fits-all. It’s about where it places you relative to the schools on your list—and how it supports the rest of your application.
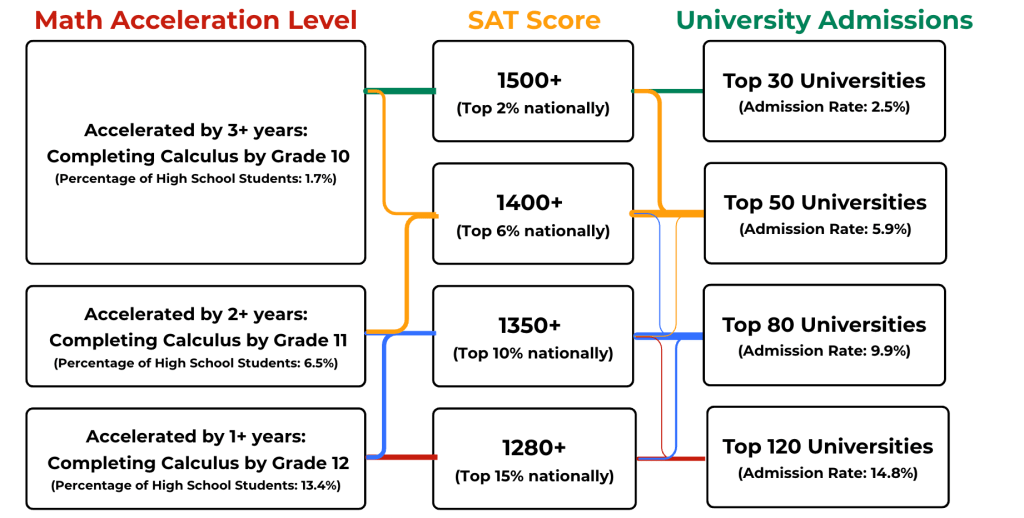
Think Academy – SAT Score Range by University Tier (with Recommended Math Track)
SAT vs. ACT Scores
The SAT and ACT are the two main standardized tests used for U.S. college admissions. Both are accepted by nearly every college, but they differ in format, timing, and content.
Score Comparison
The SAT is scored on a scale of 400 to 1600, with two section scores: Math and Evidence-Based Reading & Writing (each out of 800). The ACT uses a composite score from 1 to 36, which averages four section scores: English, Math, Reading, and Science (each out of 36). While the SAT focuses more on math and reading analysis, the ACT includes a science section and faster pacing.
Here’s how total scores compare:
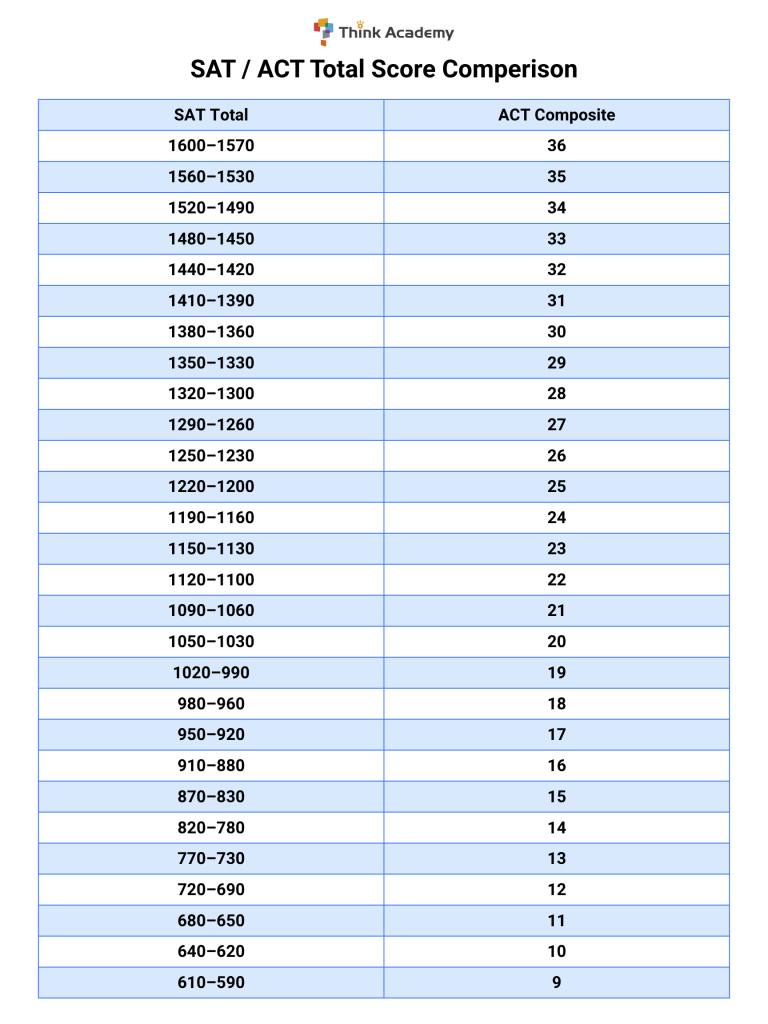
Think Academy-SAT and ACT score comparison
Download the full chart to convert SAT and ACT scores side by side.
How to Choose: SAT or ACT?
Both tests are widely accepted, but they differ in format and feel.
Choose the SAT if you prefer:
- Short, stand-alone reading questions
- Stronger focus on algebra and data analysis
- More time per question
- A digital-only format
Choose the ACT if you prefer:
- A science section
- Faster pacing with simpler questions
- Paper-based testing
- More context in reading passages
Trends to Know:
- SAT is more common on the East and West Coasts
- ACT is more popular in the Midwest and South
- At top schools like MIT and Harvard, SAT submissions are 2–3x more common than ACT
Not sure?
Take both practice tests. Choose the one that matches your strengths and test-taking style.
How Colleges Count SAT Scores: Superscore vs. Single Date vs. All Scores
Different colleges handle SAT scores in different ways. Here are the three main methods:
1. Superscore (Highest Section Total): Colleges take your best Math and Reading & Writing scores across multiple test dates.
Example:
- First test: ERW 750, Math 680
- Second test: ERW 700, Math 740
- Superscore = 750 (ERW) + 740 (Math) = 1490
Used by: Johns Hopkins, NYU, Stanford (if submitted)
2. Single Highest Test Date: Colleges only count the best total score from one date.
Example:
- First test: 750 + 680 = 1430
- Second test: 700 + 740 = 1440 (used)
Used by: Some test-optional schools
3. All Scores Required: Colleges require every SAT score you’ve taken.
- No Score Choice allowed
- All test attempts will be reviewed
- Avoid too many retakes with low scores
Used by: Georgetown University
Tip: Always check each school’s score policy. Superscoring helps most when you improve sections one at a time.
New SAT vs. Old SAT: 1600 vs. 2400 (Score Conversion)
Before 2016, the SAT was scored out of 2400 points, with separate sections for Critical Reading, Math, and Writing. Today’s SAT is out of 1600, combining Reading and Writing into one section (ERW) and keeping Math as the other. If you’re comparing older scores with new ones—for siblings, counselors, or college benchmarks—below is the comparison of total scores between new and old SAT.
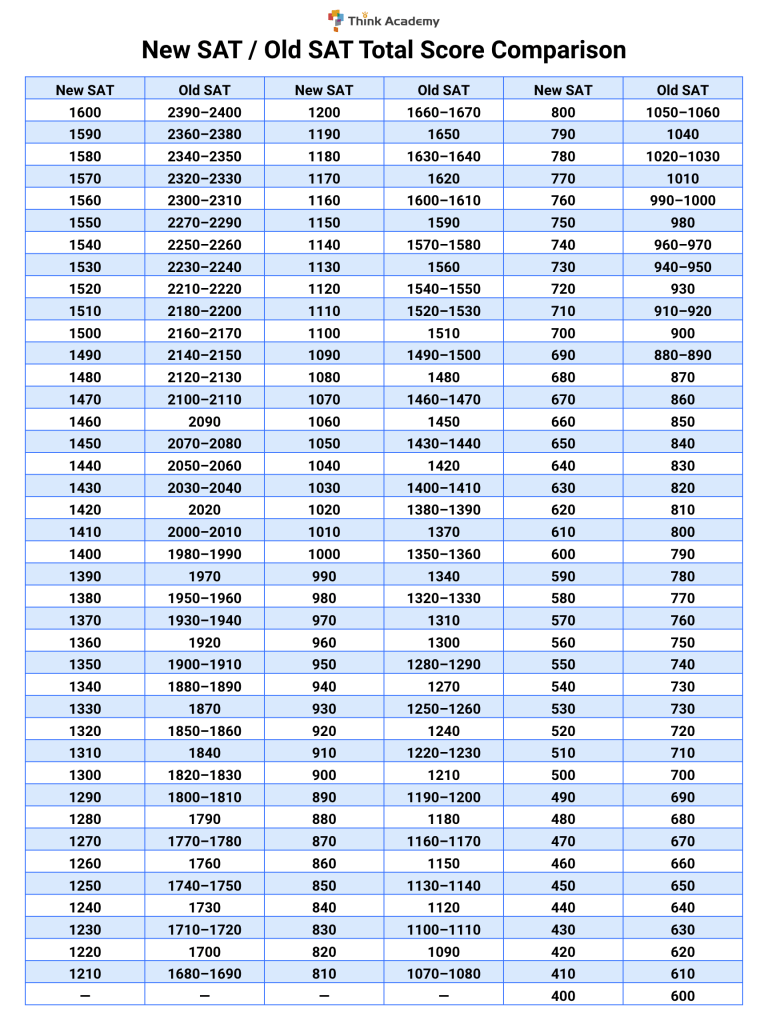
Think Academy-New SAT and Old SAT score comparison
SAT Score FAQs (Quick Answers)
Q: What’s the highest SAT score I can get?
A: The highest possible SAT score is 1600, with 800 points in Math and 800 points in Evidence-Based Reading and Writing (ERW).
Q: What is a good SAT score for Ivy League schools?
A: For Ivy League and similarly selective universities, a 1500+ SAT score is typically competitive. Many of these schools report middle-50% SAT ranges between about 1480 and 1580, meaning half of admitted students score within that range.
Q: Is 1560 / 1540 / 1480 a good SAT score?
A: Yes. All three are very strong SAT scores:
- 1560 – Exceptional. Around the 99th percentile, highly competitive for Ivy League and Top 20 universities.
- 1540 – Outstanding. Also around the 99th percentile, competitive for many highly selective universities.
- 1480 – Excellent. Around the 97th percentile, competitive for many Top 30–50 universities.
Q: What SAT score do I need for scholarships?
A: Many universities offer automatic merit scholarships starting around 1200–1300 SAT, though requirements vary by school. Highly competitive scholarships may expect 1450+ or higher, along with strong grades and extracurricular achievements.
Q: Can I improve my SAT score after the first attempt?
A: Yes. Many students improve their SAT scores after additional preparation. Taking practice tests, reviewing weak areas, and retaking the exam can often lead to higher scores.
How to Raise Your SAT Score: Math Acceleration That Works
One of the best ways to boost your SAT score is through math acceleration. The SAT draws from Algebra 1, Algebra 2, Geometry, and Precalculus—so the earlier you reach these courses, the more time you’ll have to master them before test day.
- Start early: Complete Algebra 2 by 9th or 10th grade.
- Master each step: Don’t rush—solidify Algebra and functions to avoid gaps.
- Practice smart: Use official SAT problems to connect coursework with test-style questions.
- Stay structured: A clear plan or mentor helps target weaknesses and aim for 750+ in Math.
In short: moving ahead in math—and mastering each stage—gives students a major edge for 1400–1500+ SAT scores.
to get 1-on-1 feedback on your progress and a customized study plan.
Planning Ahead in Lower Grades?
Early preparation builds the skills needed for accelerated math tracks and stronger readiness for advanced academic choices such as AP courses and the SAT. Consistent, well-structured practice helps students progress with confidence over time.
Access Think Academy’s free math worksheets for PreK through Grade 10, organized by grade and topic to support long-term skill development.
Recommended Readings
- SAT FAQs: Ultimate Guide for First-Time Takers
- 2025 Digital SAT Prep: Scores, Study Plans & Practices
Try Pengi AI — Smarter Math Practice for Students
Pengi AI supports K–12 learners with personalized math practice, guided explanations, and feedback designed to help them build confidence and improve steadily.