Pengi Editor's Note: This article was originally published by Think Academy. We're sharing it here for educational value. Think Academy is a leading K-12 math education provider.
How to Understand STAR Assessment Reports and Scores: A Parent’s Guide
If your child brought home a STAR assessment report and it left you confused or worried, you’re not alone. Many parents see phrases like “Urgent Intervention,” “4th percentile,” or “Below Benchmark” and immediately wonder:
- Is my child behind?
- Does this mean they’re struggling?
- Why doesn’t this match what the teacher says?
STAR reports are widely used in U.S. schools, but they’re often misunderstood outside the classroom. This guide explains how to read the reports correctly and what a “good” STAR score really looks like when all the data is considered together.
What Is the STAR Test — and Why Do Schools Use It?
The STAR Assessment, developed by Renaissance, is a computer-adaptive screening tool used by thousands of U.S. schools.
It’s designed to help schools:
- quickly estimate a student’s current academic level
- identify students who might need extra support
- track growth across the school year
STAR is not a diagnostic exam and not meant to stand alone.
It’s one data point — useful when interpreted correctly, confusing when read in isolation.
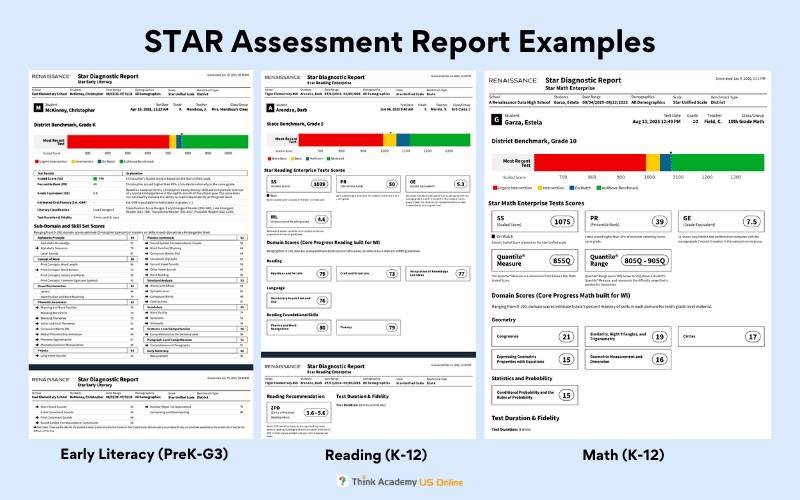
The Three Most Common STAR Assessments
Schools may administer different STAR tests depending on grade level and subject, but the three most common are:
- STAR Early Literacy Used in Pre-K through early elementary to assess foundational reading skills such as phonemic awareness, phonics, and early comprehension.
- STAR Reading Used from upper elementary through high school to measure reading comprehension, vocabulary, and language skills.
- STAR Math Used across grades to evaluate math understanding, from number sense to algebra, geometry, and statistics.
Each assessment looks different — but they all follow the same core logic.
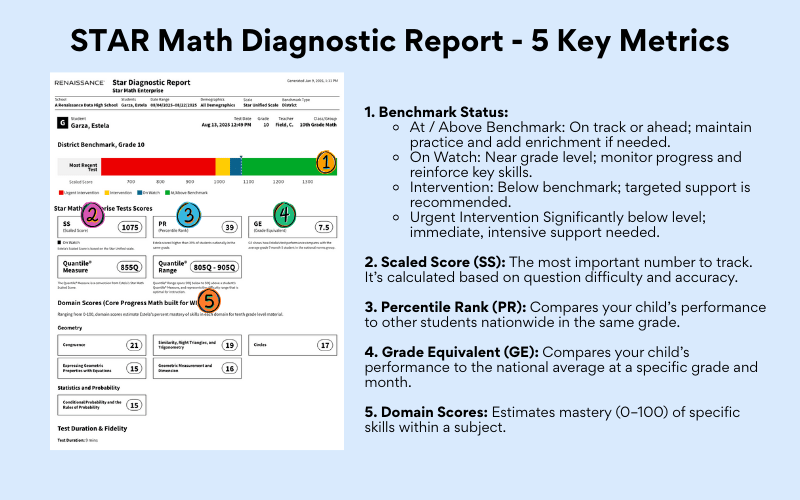
The 5 Core Metrics in Every STAR Report
Although layouts vary, all STAR reports are built on the same core metrics. Once you understand these, you can read any STAR report with confidence.
| Metric | What It Is | What It Tells You |
|---|---|---|
| 1. Benchmark Status* | Benchmark status indicates whether a student is meeting expectations under the benchmark standard selected by the school at that point in the school year. | At / Above Benchmark: On track or ahead; maintain practice and add enrichment if needed. On Watch: Near grade level; monitor progress and reinforce key skills. Intervention: Below benchmark; targeted support is recommended. Urgent Intervention Significantly below level; immediate, intensive support needed. |
| 2. Scaled Score (SS) | The most important number to track. It’s calculated based on question difficulty and accuracy. | A steadily increasing scaled score across testing windows usually signals healthy academic progress. |
| 3. Percentile Rank (PR) | Compares your child’s performance to other students nationwide in the same grade. | A 75th percentile means your child scored higher than 75% of their peers. This can fluctuate and should be read alongside the scaled score. |
| 4. Grade Equivalent (GE) | Compares your child’s performance to the national average at a specific grade and month. | A GE of 3.2 means your child scored similarly to a typical third-grader in the second month of school. It is not a grade placement recommendation. |
| 5. Domain Scores | Estimates mastery (0–100) of specific skills within a subject. | Shows which skills are developing and what instruction should focus on next. Low scores early in the year are normal. |
How STAR Benchmarks Work (Before You Read Any Scores)
One of the biggest sources of confusion in STAR assessment reports is benchmark labels.
Terms like At/Above Benchmark, On Watch, or Urgent Intervention can sound absolute — but in reality, STAR benchmarks are flexible and configurable, not one-size-fits-all.
Understanding how these benchmarks are set is essential before interpreting any STAR score.
STAR Uses Multiple Benchmark Standards — Not Just One.
STAR reports measure student performance against different possible standards, depending on how a school configures the system.
Schools may choose to benchmark student performance against:
- National norms (STAR’s default setting)
- State assessment standards
- Custom district or school benchmarks
This is why the same scaled score can look very different across schools or years.
1. National Norms (Default STAR Benchmark)
By default, STAR benchmarks are based on national norms provided by Renaissance.
Under this model:
- The 40th percentile (PR) is used as the benchmark cutoff
- Students are categorized as follows:
- At/Above Benchmark: ≥ 40th percentile
- On Watch: 25–39th percentile
- Intervention: 10–24th percentile
- Urgent Intervention: below 10th percentile
2. State Standards–Aligned Benchmarks
Some schools align STAR reports with state assessment standards instead of national averages.
In this case:
- STAR results are used to predict performance on end-of-year state tests
- Benchmark labels reflect likelihood of meeting state proficiency, not national ranking
This is common in accountability-focused states and can make benchmarks feel stricter than national norms.
3. Local (District or School) Benchmarks
Schools and districts can also create custom benchmark thresholds inside the STAR system.
These may be used to:
- identify students for local intervention programs
- align with district curriculum pacing
- support school-specific instructional goals
As a result:
A benchmark label in one district may not mean the same thing in another.
Common STAR Report Types You May See
Depending on the purpose, schools may share different STAR reports with families:
- Screening Reports Show how students are distributed across benchmark categories
- State Performance / Mastery Reports Align STAR scores with predicted state test outcomes
- Growth Reports Track progress over time using scaled score trends
Each report serves a different goal — and should be interpreted accordingly.
Why This Context Matters
STAR benchmarks are tools for decision-making, not fixed judgments.
Before reacting to any benchmark label, parents should always ask:
- Which benchmark standard is being used?
- Is this national, state-aligned, or locally defined?
- Is this a screening snapshot or a growth trend?
With that context in mind, STAR reports become far easier — and far less stressful — to understand.
Other Grade-Based Reference Metrics You May See
In addition to the core metrics above, STAR reports may include instructional reference tools depending on the subject and grade level.
These metrics support teaching decisions, not placement decisions.
- Instructional Reading Level (IRL) Suggests the text complexity a student can read successfully with instruction.
- ZPD (Zone of Proximal Development) Identifies a recommended range of book difficulty that supports growth without frustration.
- Quantile® Measure (Math) Indicates the difficulty level of math content most appropriate for instruction.
These tools help schools choose what to teach next, but they should always be interpreted alongside scaled score, benchmark status, and domain scores.
How to Read a STAR Math Report (A Step-by-Step Example)
STAR Math reports are often the most detailed and intimidating. If you can read this one, you can read any STAR report.
Below is a complete, parent-ready interpretation of this specific Grade 10 STAR Math report, written in clear, calm language and aligned with how schools actually use STAR data.
This can stand alone as a report explanation or drop directly into your blog as a worked example.
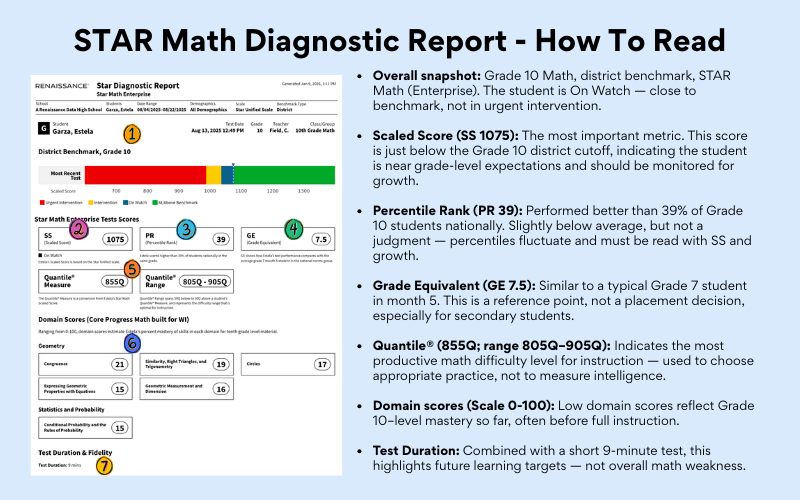
1. Overall Performance Snapshot
- Grade: 10
- Subject: Math
- Benchmark Type: District
- Most Recent Test: STAR Math (Enterprise)
At a glance, this report places the student in the “On Watch” range — not at benchmark yet, but not in urgent intervention either. This is a monitoring signal, not a failure signal.
2. Scaled Score (SS): 1075
Benchmark Status: On Watch
The Scaled Score is the most important number on the report.
What this tells us:
- The score is calculated on the STAR Unified Scale
- It allows comparison across time and grades
- A score of 1075 places the student just below the district’s Grade 10 benchmark cutoff
Key interpretation:
This student is close to grade-level expectations but has not fully met them yet.
Schools typically monitor students in this range rather than placing them into immediate intervention.
What matters next:
- Whether this score increases in future testing windows
- Whether classroom performance aligns with this result
3. Percentile Rank (PR): 39
The Percentile Rank compares the student to other Grade 10 students nationwide.
- PR 39 = scored higher than 39% of students in the same grade nationally
How to read this correctly:
- This is slightly below the national average (50)
- It does not mean the student is weak at math
- Percentiles are sensitive to test conditions and can fluctuate
Important:
Percentile Rank is context — not a judgment. It should always be read together with scaled score and growth.
4. Grade Equivalent (GE): 7.5
The Grade Equivalent shows how this performance compares to national norms.
- GE 7.5 = similar to the average student in Grade 7, Month 5
This often causes confusion, especially for older students.
What GE does not mean:
- It does not mean the student “should be in 7th grade math”
- It does not mean the student lacks higher-grade knowledge
- It does not account for curriculum exposure or course placement
Correct way to use GE:
GE is a reference point, not a placement decision. For secondary students, schools rely far more on scaled score, growth, and course performance.
5. Quantile® Measure: 855Q
Quantile® Range: 805Q – 905Q
This is one of the most useful — and most misunderstood — parts of a STAR Math report.
What Quantile tells us:
- 855Q is the student’s estimated math difficulty level
- 805Q–905Q is the optimal instructional range
How schools use this:
- To select practice problems and materials
- To avoid content that is far too easy or too frustrating
- To support targeted remediation or reinforcement
Key takeaway:
Quantile is about what level of math to teach next, not how smart the student is.
6. Domain Scores: Why These Look Low (and Why That’s Normal)
This section often causes the most parent anxiety.
Geometry Domains (15–21 range)
- Congruence: 21
- Similarity, Right Triangles & Trigonometry: 19
- Circles: 17
- Geometric Measurement & Dimension: 16
- Expressing Geometric Properties with Equations: 15
Statistics & Probability
- Conditional Probability & Rules of Probability: 15
At first glance, these numbers look alarming — but here’s the key context:
What Domain Scores Actually Mean
- Domain scores estimate percent mastery of Grade 10-level material
- They assume exposure to the full Grade 10 curriculum
- Scores can be low if:
- content has not been fully taught yet
- the test occurred early in the school year
- the student missed several adaptive questions early
STAR itself notes:
Skills with low scores may not yet have been taught or may be too difficult at this time.
Correct interpretation:
These domain scores identify future learning targets, not deficiencies in overall math ability.
7. Test Duration & Fidelity: 9 Minutes
The test duration is relatively short.
Why this matters:
- STAR is adaptive and time-sensitive
- Quick tests can magnify the impact of:
- early mistakes
- rushing
- reduced focus
This is another reason schools do not rely on one test alone.
8. Putting It All Together: What This Report Really Says
This STAR Math report suggests:
- The student is slightly below Grade 10 benchmark, but close
- Performance is near national average
- Instruction should target math content around 805Q–905Q
- Grade-level geometry and probability concepts are not yet mastered, which is common
- This is a monitoring situation, not an emergency
In plain terms:
The student is functioning within a reasonable range but would benefit from targeted support and continued instruction — especially as Grade 10 math content unfolds.
How to Understand and React
A parent-friendly way to decide: “Should I celebrate, worry, or ask questions?”
Parents usually have one of two reactions to STAR reports:
- “My child scored very low — but they read fine at home. Is STAR wrong?”
- “My child scored in the 90th+ percentile — is this as impressive as it sounds?”
Both reactions are normal. STAR can be useful, but only when you interpret it the way schools intend: as a screening snapshot plus trend, not a final verdict.
Here’s a practical, balanced framework.
1) First, remember what STAR is (and what it isn’t)
STAR is a computer-adaptive screener from Renaissance. It adjusts question difficulty based on the student’s answers.
That means:
- It’s not meant to be “aced” the way a normal test is
- It’s designed to find a student’s working level efficiently
- One sitting can be influenced by attention, stamina, test-taking behavior, and environment
Parent takeaway:
Treat STAR like picture day: a useful snapshot, but not the whole story.
2) If your child scores very high: yes, it usually means they’re doing well — but celebrate the right way
High percentiles (like 90–99 PR) generally suggest strong academic skills compared with same-grade peers nationally.
But a few things help you interpret how big that signal is:
Why high scores can be meaningful
- STAR has a large test bank and adaptive design
- Percentile rank compares your child to many students nationwide (based on norms)
Why you should still keep it in perspective
- Grade comparisons can include students tested at different times of the year
- Many systems “roll over” grade comparisons around summer
- Early fall scores can be compared against peers who tested late spring (often a bit stronger)
- Some students are simply strong computer test-takers
- Question exposure can repeat if students test often
How to react as a parent (best practice)
- Celebrate effort, habits, and curiosity, not “being smart”
- Ask: Is my child also demonstrating this level in classwork and reading choices?
- If yes: consider adding more challenge (deeper reading, richer math tasks), not just “more worksheets”
Parent-friendly line you can use:
“Your scores suggest you’re ahead right now — let’s keep building strong habits so learning stays fun even when it gets harder.”
3) If your child scores surprisingly low: don’t panic — check validity before you assume a skill problem
Teachers and intervention specialists commonly see cases where:
- a child reads well in class and at home
- but STAR flags Intervention or even Urgent Intervention
This can happen for normal reasons, especially in grades K–2:
- the child rushed, clicked randomly, or didn’t take it seriously
- the child didn’t understand the computer test format
- the child zoned out, got distracted, or was tired/hungry
- the child struggled with mouse/trackpad use
- the child lacked stamina for long passages (especially if given STAR Reading too early)
What parents should do first
- Compare to classroom evidence
- teacher reading groups
- writing samples
- homework accuracy
- what books the child can actually read and retell
- Ask about testing conditions
- time on test (did they finish unusually fast?)
- did the test get paused? were there interruptions?
- was it the correct assessment (Early Literacy vs Reading)?
- Look for a pattern
- one low score = often noise
- repeated low scores across windows = worth investigating
A calm parent script:
“This result doesn’t match what we see at home. Can you share how long the test took, whether it seemed valid, and whether it’s consistent with classroom data?”
4) Use the “Two-Source Rule” before you worry (or before you brag)
A simple rule that aligns with how schools actually make decisions:
Don’t make a big conclusion from STAR unless two independent sources agree.
Examples of “two sources”:
- STAR trend + classroom performance
- STAR domain gaps + teacher observation
- STAR score + another screener (MAP, i-Ready, DIBELS, etc.)
If STAR is the only thing saying there’s a problem (or the only thing saying your child is “years ahead”), treat it as a prompt to learn more, not a final answer.
5) Focus on trend lines, not one-day labels
STAR can fluctuate. What you want is a stable story across time:
A healthy pattern looks like
- Scaled Score increases across the year
- Benchmark category stays stable or improves
- Domain/skill scores gradually move upward as content is taught
A “follow up” pattern looks like
- scores swing wildly with no explanation
- multiple windows show low percentiles + low classroom performance
- the student consistently rushes tests or struggles with attention during testing
6) When STAR results trigger intervention letters but the school says “on track”
This mismatch happens more often than parents realize because:
- STAR is a screener that can flag risk quickly
- schools often have automated processes tied to benchmark categories
- teachers and principals use multiple data points before changing placement
So if you get conflicting messages, the right response is:
- request context
- ask what other measures the school uses
- ask what support is happening in class (even if no formal intervention)
Bottom line for parents
- High percentiles are usually a real sign of strength — celebrate effort and keep the challenge healthy.
- Low percentiles are not automatically a crisis — verify testing conditions and compare with classroom data.
- The most reliable way to use STAR is trend + context, not a single score.
If you want, I can turn this into a blog-ready section with:
- a “What to do next” decision tree (High / Medium / Low)
- short scripts for emailing the teacher
- and a one-paragraph summary box for skimmers.
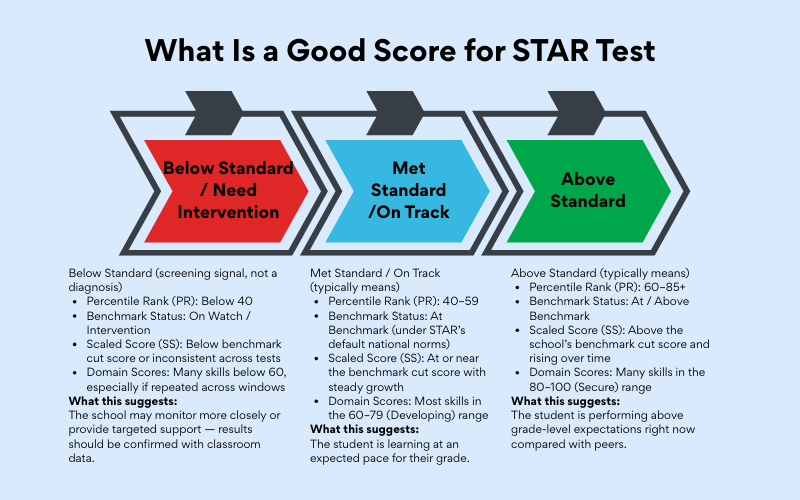
So… What Is a “Good” STAR Score on STAR Assessment?
Because STAR is a screening and progress-tracking assessment, there is no single “perfect” score. Schools look at ranges, not exact cutoffs.
Above Standard (typically means)
- Percentile Rank (PR):60–85+
- Benchmark Status:At / Above Benchmark
- Scaled Score (SS):Above the school’s benchmark cut score and rising over time
- Domain Scores: Many skills in the 80–100 (Secure) range
What this suggests: The student is performing above grade-level expectations right now compared with peers.
Met Standard / On Track (typically means)
- Percentile Rank (PR):40–59
- Benchmark Status:At Benchmark (under STAR’s default national norms)
- Scaled Score (SS):At or near the benchmark cut score with steady growth
- Domain Scores: Most skills in the 60–79 (Developing) range
What this suggests: The student is learning at an expected pace for their grade.
Below Standard (screening signal, not a diagnosis)
- Percentile Rank (PR):Below 40
- Benchmark Status:On Watch / Intervention
- Scaled Score (SS):Below benchmark cut score or inconsistent across tests
- Domain Scores: Many skills below 60, especially if repeated across windows
What this suggests:
The school may monitor more closely or provide targeted support — results should be confirmed with classroom data.
Important Reminder for Parents
STAR is designed to:
- screen for possible risk
- track growth over time
It is not meant to:
- label a child
- stand alone
- replace teacher observation or classroom performance
Trend + context matter more than any single score.
How Think Academy Can Help After the STAR Assessment
If your child’s STAR results raised questions — whether about placement readiness, skill gaps, or next-level challenge — the most helpful next step is targeted, short-term preparation, not guesswork.
Think Academy Math Placement Test Prep Bootcamp (Grades 5–6)
Our bootcamp is designed for students preparing for middle school math placement tests, especially families who want clarity before the school year begins.
What the bootcamp includes:
- Free Diagnostic Assessment (i-Ready–Aligned) Start with an official-style assessment to pinpoint your child’s current math level and identify strengths and gaps across key domains.
- Four Live, Small-Group Sessions (2 hours each) Focused instruction across the four core placement modules:Computation · Algebra · Geometry · Statistics Each session includes personalized teacher feedback and follow-up guidance.
- A Clear Math Pathway Beyond the Test Placement tests are just one moment. We help families understand what comes next — with a structured roadmap from middle school through high school math.
For parents: This bootcamp turns assessment results into actionable next steps, so you’re not reacting to scores — you’re planning with confidence.
Register Today
Try Pengi AI — Smarter Math Practice for Students
Pengi AI supports K–12 learners with personalized math practice, guided explanations, and feedback designed to help them build confidence and improve steadily.