Pengi Editor's Note: This article was originally published by Think Academy. We're sharing it here for educational value. Think Academy is a leading K-12 math education provider.
What Is a Good MAP Score? How to Understand RIT, Percentiles & Growth
After your child takes the NWEA MAP Growth test, you receive a report filled with numbers—RIT scores, percentiles, and growth projections. It’s easy to feel overwhelmed and ask the one question on every parent’s mind: “Is this a good score?”
While it’s a natural question, the answer isn’t a simple “yes” or “no.” A “good” MAP score depends on three key factors: your child’s grade, their percentile ranking, and, most importantly, their academic growth over time. This guide will help you read your child’s MAP report in a calm, confident, and useful way.
MAP Is Not a Pass/Fail Test
Before diving into the numbers, it’s crucial to remember that MAP Growth is a growth assessment. Its primary purpose is not to deliver a one-time verdict on your child’s ability but to measure their progress over the school year. The most important question to ask is not “Did my child pass?” but rather:
“Is my child learning and growing at a healthy rate?”
This is why schools administer the test multiple times a year—typically in the fall, winter, and spring. A single score is just a snapshot; the trend across these snapshots tells the real story.
Decoding the Numbers: RIT Scores and Percentiles
Your child’s report will feature two key metrics: a RIT score and a percentile. They answer two different questions.
What Is a RIT Score?
The RIT score (short for Rasch Unit) is your child’s overall score on the test. It’s a stable, equal-interval scale, like a ruler, that measures academic knowledge. As your child learns and grows, their RIT score is expected to increase.
- What it tells you: The difficulty level of questions your child is ready to tackle. A higher RIT score means a student is ready for more complex material.
- What to remember: RIT scales are different for each subject. A RIT score in math cannot be directly compared to one in reading. Think of them as measuring two different types of height—one for a tree and one for a building.
What Is a Percentile Ranking?
The percentile shows how your child’s RIT score compares to that of other students in the same grade nationwide who took the test in the same season. It answers the question, “How does my child’s performance compare to their peers?”.
| Percentile Range | What It Generally Means |
|---|---|
| 90th–99th | Exceptional; in the top 10% of students nationally. |
| 75th–89th | High Average to High; performing above the national average. |
| 25th–74th | Average; performing within the typical range of peers. |
| 1st–24th | Low to Low Average; may indicate a need for additional support. |
Important: A percentile is not a percentage correct. A student in the 95th percentile did not answer 95% of the questions correctly. Because the test is adaptive, they were likely challenged with very difficult questions. Their high percentile means they correctly answered questions of a much higher difficulty level than most of their peers.
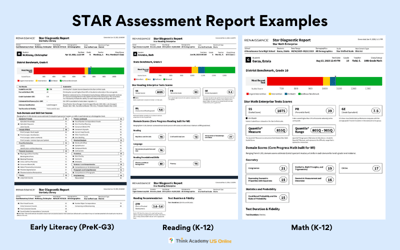
The Five Types of MAP Growth Reports
MAP Growth provides different reports for different audiences. As a parent, you’ll primarily receive the Family Report, but understanding the full picture helps you know what information your child’s teacher and school are using to support learning.
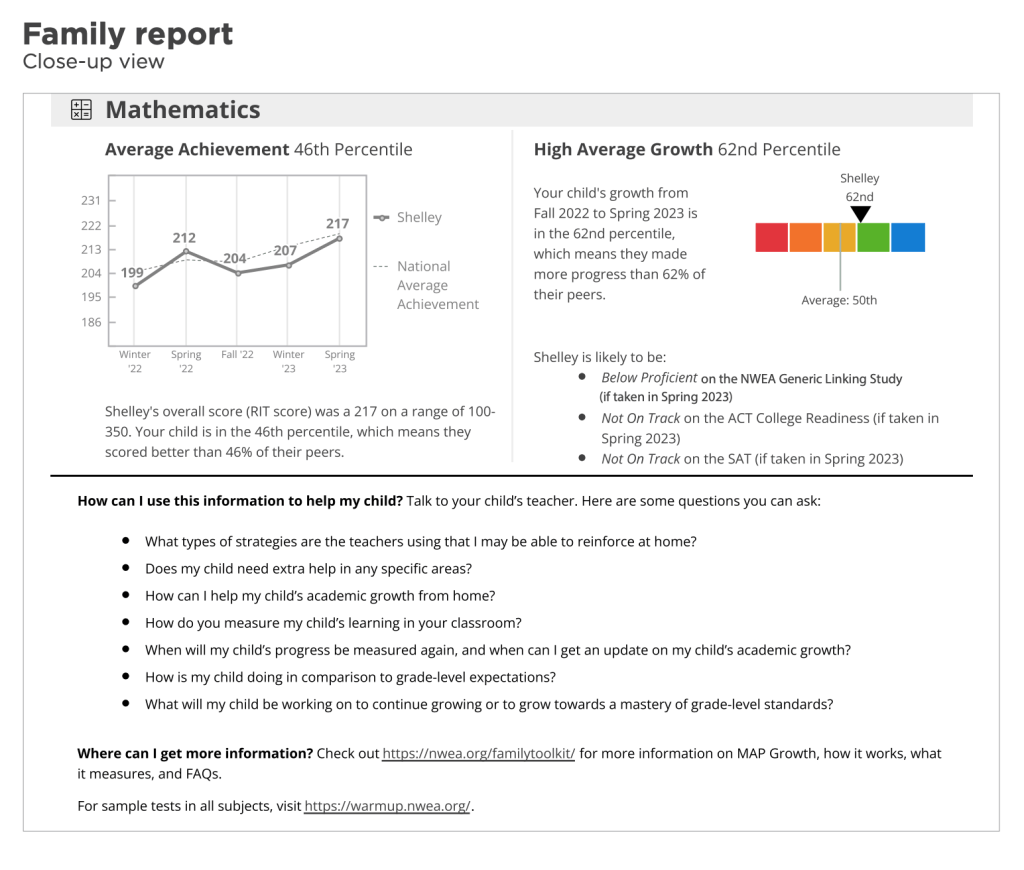
1. Family Report (What Parents Receive)
This is the straightforward report designed specifically for parents and caregivers. It shows your child’s most recent test results in an easy-to-understand format.
What it includes:
- Your child’s RIT score for each subject tested (Reading, Math, Language Usage, and Science if applicable)
- Achievement percentile showing how your child compares to students nationwide
- Growth percentile showing how much your child improved compared to similar students
- A visual chart tracking progress across fall, winter, and spring testing windows
Why it matters: This report is designed to facilitate meaningful conversations during parent-teacher conferences and help you support your child’s learning at home. It answers the key questions: “Where is my child now?” and “How much are they growing?”
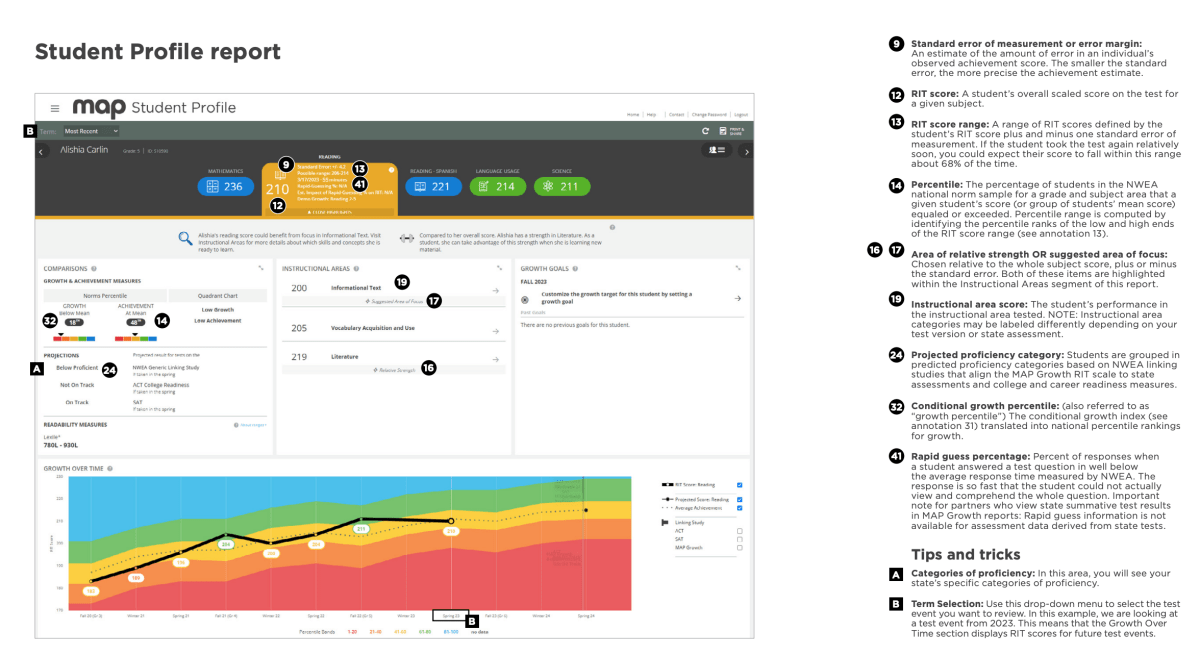
2. Student Profile Report (What Teachers Use)
Teachers use this detailed individual report to understand each student’s learning journey and plan instruction accordingly.
What it includes:
- Achievement data for every test event throughout the year
- Growth measurements over time compared to national norms
- Projections for year-end state test performance
- Specific skill area breakdowns showing strengths and opportunities
How it helps your child: This report allows teachers to differentiate instruction, ensuring your child receives the right level of challenge and support in each subject area.
3. Class Profile Report (Classroom Planning)
This report gives teachers a bird’s-eye view of their entire class, helping them form learning groups and identify which students need additional support or enrichment.
What it reveals:
- Overall class performance in each subject
- Which students have completed testing
- Students who may have rushed through the test (rapid-guessing indicators)
- Skill areas where the whole class is strong or needs more work
Why it matters for your child: This data helps teachers create flexible learning groups, so students work with peers at similar levels and receive targeted instruction.
4. School Profile Report (School-Level Decisions)
School administrators use this aggregate data to make decisions about curriculum, resources, and intervention programs.
What it shows:
- How each grade and class performs compared to national norms
- Which grades or cohorts may need additional support
- The impact of previous instructional decisions and programs
The bigger picture: These insights help schools allocate resources effectively, ensuring programs that work are expanded and areas of concern receive attention.
5. District Profile Report (System-Wide Strategy)
District leaders use this comprehensive view to understand achievement and growth patterns across all schools, guiding policy and resource decisions at the highest level.
For more details of MAP Growth Report Portfolio, check this page.
What the Numbers Really Mean
The most important concept in MAP Growth is right there in the name: growth. A single score tells you where your child is at one moment in time. Growth tells you if they’re learning and progressing at a healthy rate.
The Two Key Metrics: Achievement vs. Growth
Achievement Percentile answers: “How does my child compare to other students in the same grade nationwide?”
- 50th percentile = average (right in the middle)
- 75th percentile = above average (better than 75% of students)
- 90th percentile = high achievement (better than 90% of students)
Growth Percentile (CGP – Conditional Growth Percentile) answers: “How much did my child grow compared to students who started at the same level?”
- 50th percentile = typical growth
- Above 50th = faster than typical growth
- Below 50th = slower than typical growth
Here’s why both matter: A student could be at the 40th percentile in achievement but at the 70th percentile in growth—meaning they’re learning quickly and catching up. Conversely, a student at the 95th percentile in achievement but 30th in growth may need more challenge to stay engaged.
MAP Growth Expectations: What’s Normal?
Based on national data from millions of students, here’s what typical growth looks like in math for elementary students. Understanding these benchmarks helps you interpret your child’s progress.
MAP Math Norms (2025): Achievement + Growth at a Glance
Based on 2025 MAP Growth norms from NWEA
How to read this table
- Achievement (RIT) = where a student is academically at a specific point in the year
- Growth (RIT change) = how much a student typically improves over time
- Norms assume:
- Fall = week 4
- Winter = week 20
- Spring = week 32 of instruction
2025 MAP Math Norms (Grades K–8)
The tables below present the 2025 MAP Math achievement norms, including mean RIT scores by testing term and typical RIT growth between terms. These figures represent national averages and can be used as reference norms. The first table includes grades K–8, while the second includes grades 9–12.
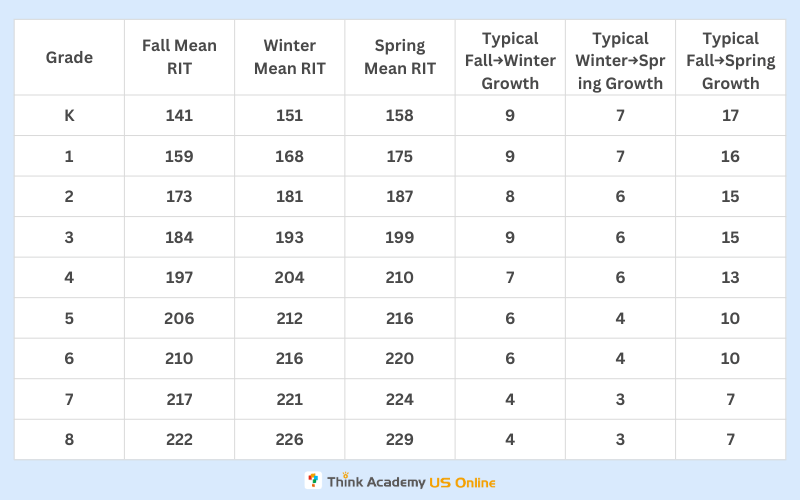
Important trend to notice: Math growth is faster in early grades and naturally slows in middle school, even when students are doing well.
2025 MAP Math Norms (Grades 9–12)
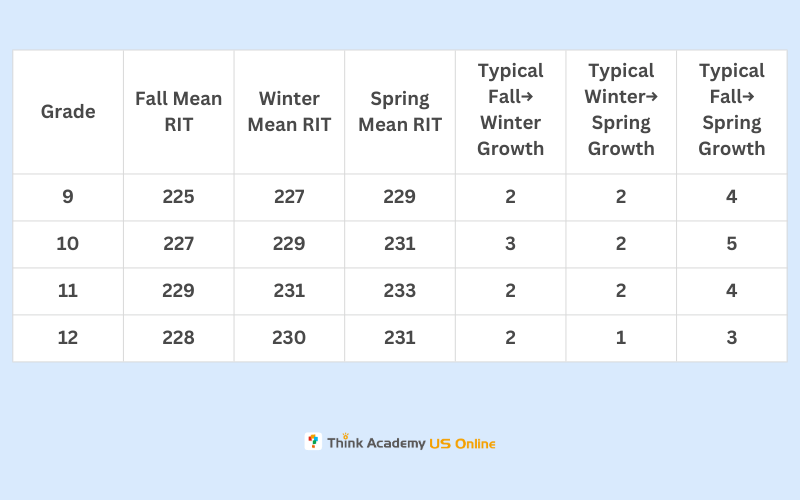
Key takeaway for older students: Smaller growth numbers are normal and expected—high school math learning becomes deeper and more specialized, which MAP is not designed to fully capture.
Visit this page to view the complete 2025 MAP Growth norms.
After understanding these two dimensions of MAP reports, the next question is how to interpret their impact and decide what actions to take.
How to Interpret MAP Math Performance
MAP Math results are most meaningful when you look at achievement and growth together, not in isolation. A student’s RIT score shows where they are academically at a specific point in the year, while growth shows how much they are improving compared to national norms.
For example, a Grade 3 student with a Spring RIT around 199 is performing near the national average for that grade and season. If that student grew about 15 RIT points from fall to spring, they are making typical, healthy progress, even if their percentile stayed the same. This is because MAP compares students to peers nationwide—maintaining a percentile while RIT increases means the student is learning at a steady pace alongside others.
It’s also important to understand that expected math growth naturally slows as students get older. A Grade 1 student may grow 16–17 points in a year, while a Grade 7 student may grow only 7 points—and both can still be doing very well. In middle and high school, MAP Math focuses on foundational, grade-common skills, so advanced coursework (such as Algebra II or calculus) may not fully reflect in large RIT gains.
When reviewing MAP Math scores, parents should focus on:
- Whether the RIT score is appropriate for the grade and season
- Whether the student is meeting or exceeding typical growth expectations
- Whether growth is consistent across testing windows, not just high or low in one term
In short, steady growth matters more than a single number. MAP is best used as a long-term progress tool, not a one-time judgment of ability.
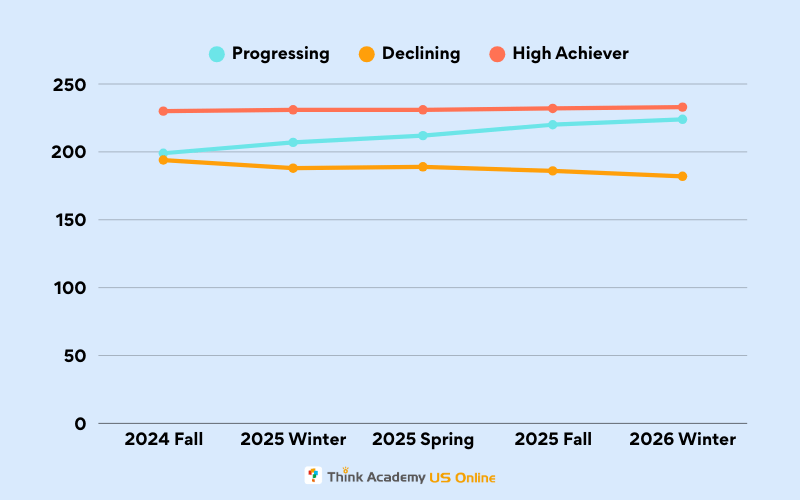
How to Interpret Your Child’s Growth Chart
Your Family Report includes a visual chart showing your child’s RIT scores across testing terms. Here’s how to interpret what you see:
The Ideal Pattern: Steady Upward Trajectory
What it looks like: A line that moves consistently upward from fall to winter to spring, with each point higher than the last.
What it means: Your child is learning at a healthy rate and making consistent progress. Even if the line isn’t perfectly steep, steady upward movement is excellent news.
Pattern to Watch: Flat or Declining Line
What it looks like: Scores that stay the same or drop between testing windows.
What it might mean:
- Fall to winter drop: Possible summer learning loss or adjustment to new grade-level material
- Flat growth: May indicate the student needs more challenge, or conversely, is struggling with current material
- Winter to spring drop: Could signal test-day issues (illness, rushing, stress) or a genuine learning concern
What to do: Schedule a conversation with your child’s teacher. One flat or declining term isn’t necessarily cause for alarm, but it’s worth understanding the context.
The High Achiever Plateau
What it looks like: A student at the 90th+ percentile whose scores stay relatively flat across terms.
What it might mean:
- The student may already know much of the grade-level material
- They might need enrichment or acceleration to continue growing
- In some cases, high achievers “coast” because they’re not being challenged
What to do: Ask the teacher if your child is receiving appropriately challenging work. High achievement is wonderful, but continued growth is the goal.
In summary, “good growth” usually means:
- Consistent upward movement from fall to spring
- Growth percentile at or above the 50th percentile (meeting or exceeding typical growth)
- Alignment between MAP results and classroom performance
- Your child feeling challenged but not overwhelmed in class
Remember: MAP Growth is a tool, not a judgment. Its purpose is to help teachers teach and parents support—ensuring every child continues learning and growing throughout the year.
How to Take Action After Receiving MAP Results
The MAP report is not a final grade; it’s a tool for action. Use it to partner with your child’s teacher.
- Ask for the Goal Area Breakdown: The report breaks down each subject into specific skills (e.g., “Algebraic Thinking” or “Informational Text”). Ask the teacher to identify your child’s top 1–2 strengths and their top 1–2 areas for focus.
- “Is my child’s growth on track compared to national norms?” This focuses on the most important metric: progress over time.
- “What are my child’s top two strengths and top two areas for growth?” The report breaks subjects into specific skills. Knowing these helps you support learning at home.
- “How does my child’s MAP performance align with their classroom work?” If there’s a mismatch, it’s worth exploring why.
- “What can I do at home to support the areas where my child needs growth?” Teachers can suggest specific activities, books, or practice areas.
- “Should we retest if the results seem unusual?” If your child was sick, rushed, or had a bad day, retesting might provide more accurate data.
- Build a Small, Consistent Routine: You don’t need to become a tutor overnight. Dedicate 10–15 minutes, a few times a week, to practicing the focus skills identified by the teacher. For a student needing help with fractions, this could be baking together. For a child working on vocabulary, it could be a fun word-of-the-day game.
- Follow Up and Monitor: Check in with the teacher before the next testing window. The goal is to use the MAP data to create a supportive learning loop between home and school.
Ultimately, a “good” MAP score is one that leads to productive conversations and targeted support, ensuring your child continues to learn and grow with confidence.
Key Takeaways for Parents
- Focus on growth, not just achievement. A student growing from the 30th to the 50th percentile is making tremendous progress.
- One score is just a snapshot. The trend across fall, winter, and spring tells the real story.
- Use the Family Report to start conversations, not to create stress. It’s a tool for partnership between home and school.
- Celebrate progress. If your child is growing consistently, they’re on the right track—regardless of their percentile.
Your child’s learning journey is unique. MAP Growth simply provides a map to help guide the way.
Quick FAQs
Q: What is considered a “good” MAP score?
A: A good MAP score is not defined by a single number. Instead, it reflects both achievement and growth. Achievement percentiles show how a student performs compared to peers nationwide in the same grade and season, while growth percentiles show how much progress the student has made compared to students who started at a similar level.
On MAP Growth, the 50th percentile represents typical performance or growth. Scores above or below this point provide context, but they do not define success on their own. The most meaningful MAP results show that a student is performing at an appropriate level for their grade and making steady, healthy progress over time, based on norms from NWEA.
Q: Is the 75th percentile a good MAP score?
A: Yes, the 75th percentile is generally considered a strong score, indicating performance above the national average. However, consistent growth over time remains the most important indicator of success.
Q: Why did my child’s score drop from spring to fall? A slight dip from spring to fall is common and often referred to as “summer slide.” It reflects a natural forgetting of some material over the break. The key is to see if the score rebounds and grows by the winter and spring tests.
A: Should my child study for the MAP test? MAP Growth is not designed for cramming. The best preparation is consistent engagement in school, daily reading, and fostering a curious, problem-solving mindset at home. Focus on long-term learning, not short-term test prep.
Final Words
MAP scores are most valuable when they lead to strong growth and the right next steps, not just higher numbers. At Think Academy, we help students turn MAP results into meaningful progress—building solid foundations, accelerating learning where appropriate, and planning long-term academic pathways all the way to secondary advanced tracks such as Honors and AP courses.
If you want to understand how your child’s MAP scores translate into a clear, personalized learning path, take our free evaluation to get professional guidance on what to focus on next.
_T_ry the Free Math Evaluation
Try Pengi AI — Smarter Math Practice for Students
Pengi AI supports K–12 learners with personalized math practice, guided explanations, and feedback designed to help them build confidence and improve steadily.